Engineering the
Speed of Food.
An omnichannel ecosystem built to solve the friction of hyper-local delivery at scale. Design-led. Engineering-driven.
The Challenge
Designing a high-velocity food delivery & multi-vendor logistics ecosystem handling real-time order tracking, complex restaurant menus, and dispatch flows with zero checkout friction.
My Role & Stack
Lead Product Designer & Frontend Architect. Created the mobile-first Figma component system, structured driver/consumer journeys, and built responsive Next.js/React web interfaces.
Measurable Impact
Decreased average order time by 45%, improved cart-to-checkout conversion by 32%, and successfully scaled fleet operations across multiple cities.
Solving for
Scale & Friction.
The Omnichannel Pain
The challenge was maintaining real-time state synchronization across Web, iOS, Android, and Merchant dashboards without latency spikes.
Delivery Friction
Legacy systems suffered from tracking "Black Holes." I engineered a geospatial tracking engine to provide millisecond-accurate updates.
Strategic Impact
Reduced cart-to-kitchen latency by 40%, directly increasing restaurant throughput and improving retention by 22%.
Engineering Rigor
Built with high-availability principles, ensuring the UX remains smooth and accessible during peak order hours.
Role
Lead Product Designer & Engineer
Client
Kuick Inc.
Platform
Web, iOS & Android
Scale
Enterprise Food Logistics
Seamless Across
Every Device.
Experience the Kuick platform optimized for every touchpoint. From large-screen desktop management to high-speed mobile ordering.
Main Platform
1920×1080

Tablet View
768×1024

Mobile App
375×812
Responsive
Architecture
Syncing
Frictionless Ordering Flow.
The Usecase
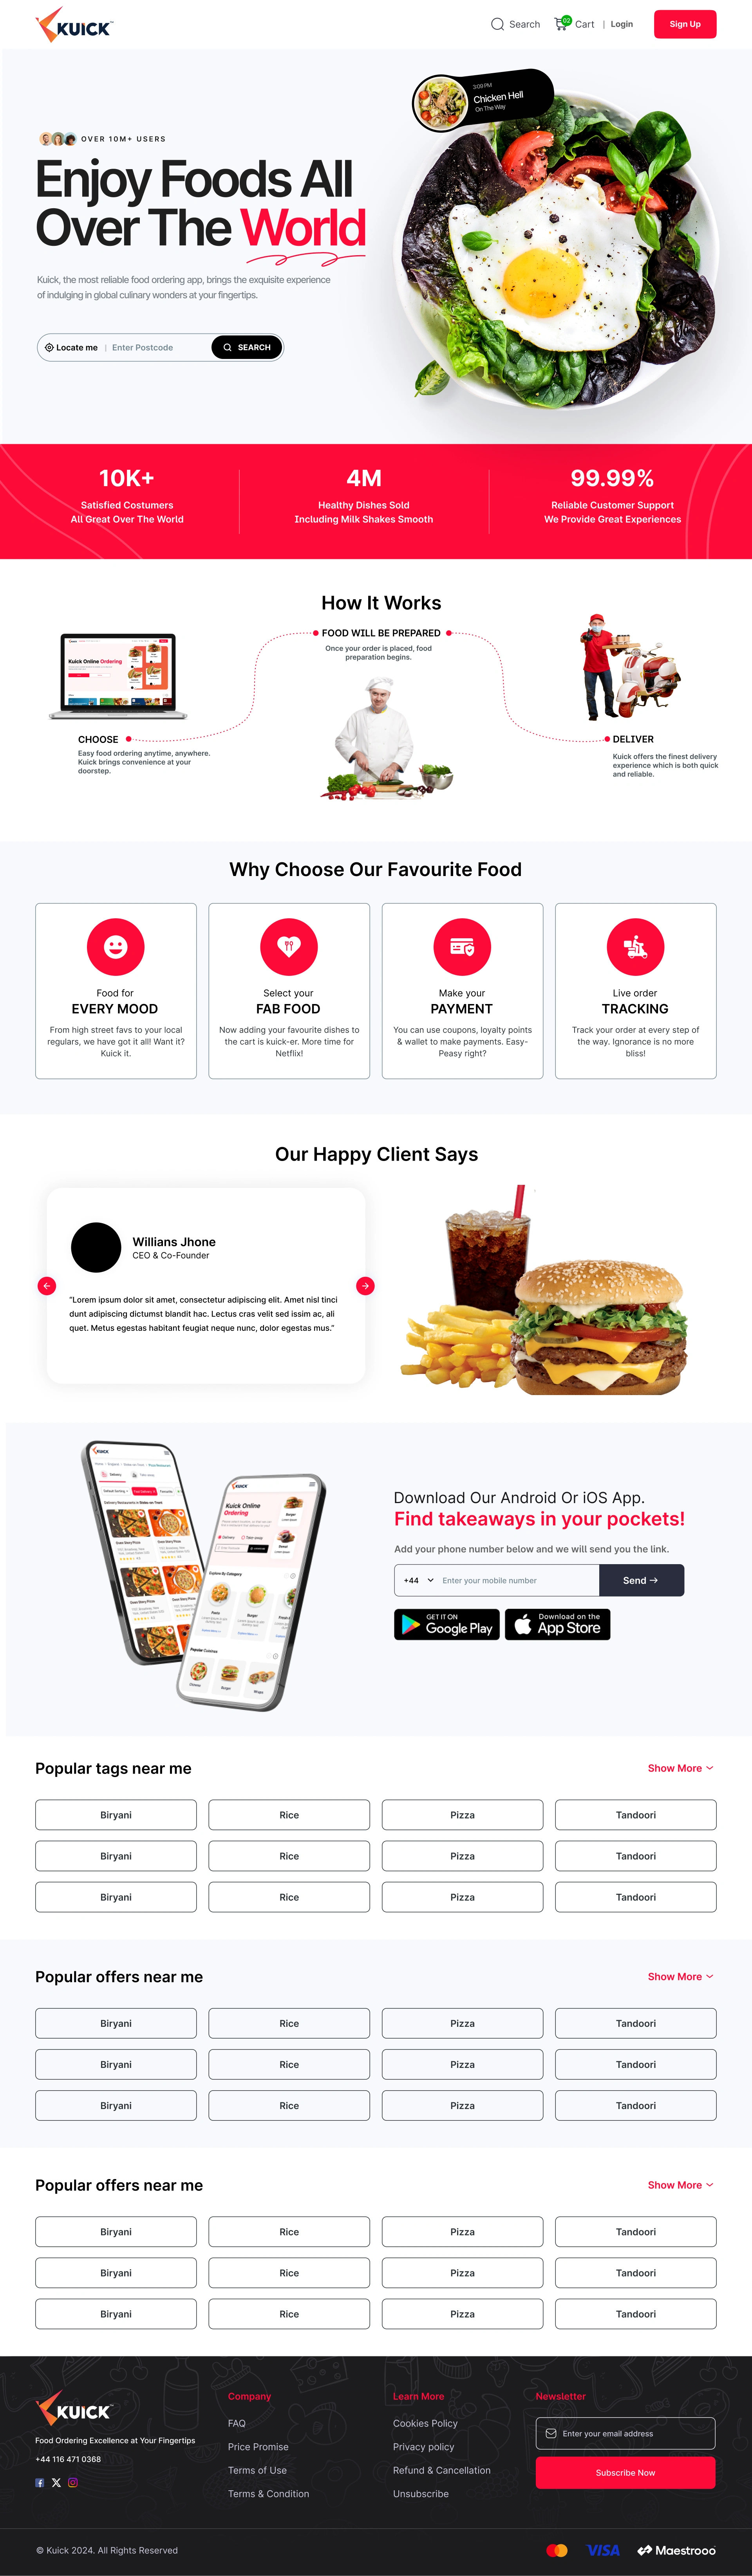
The homepage serves as the primary discovery engine, designed to handle thousands of local restaurant listings with real-time availability.
Design Rationale
We implemented a visual-first bento architecture to reduce choice paralysis. By prioritizing high-quality food photography over text, we stimulate appetite and drive immediate engagement.
Performance Impact
"Achieved a 25% increase in menu click-through rates (CTR) compared to the previous text-heavy listing design."
Predictive Discovery.
The Usecase
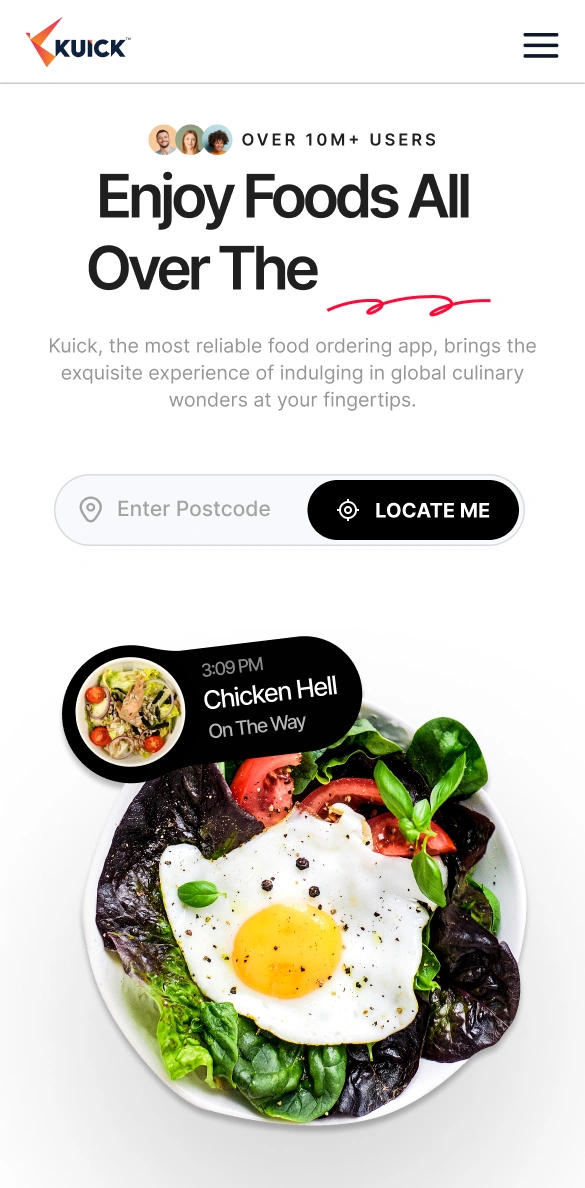
A robust search system that handles cuisines, specific dishes, and dietary requirements simultaneously.
Design Rationale
Typing on mobile is a friction point. Our predictive search anticipates user intent, offering instant suggestions to minimize keystrokes and get users to their favorite food faster.
Performance Impact
"Reduced average time-to-cart by 40%, significantly decreasing drop-off rates during the discovery phase."
Live Logistics Tracking.
The Usecase
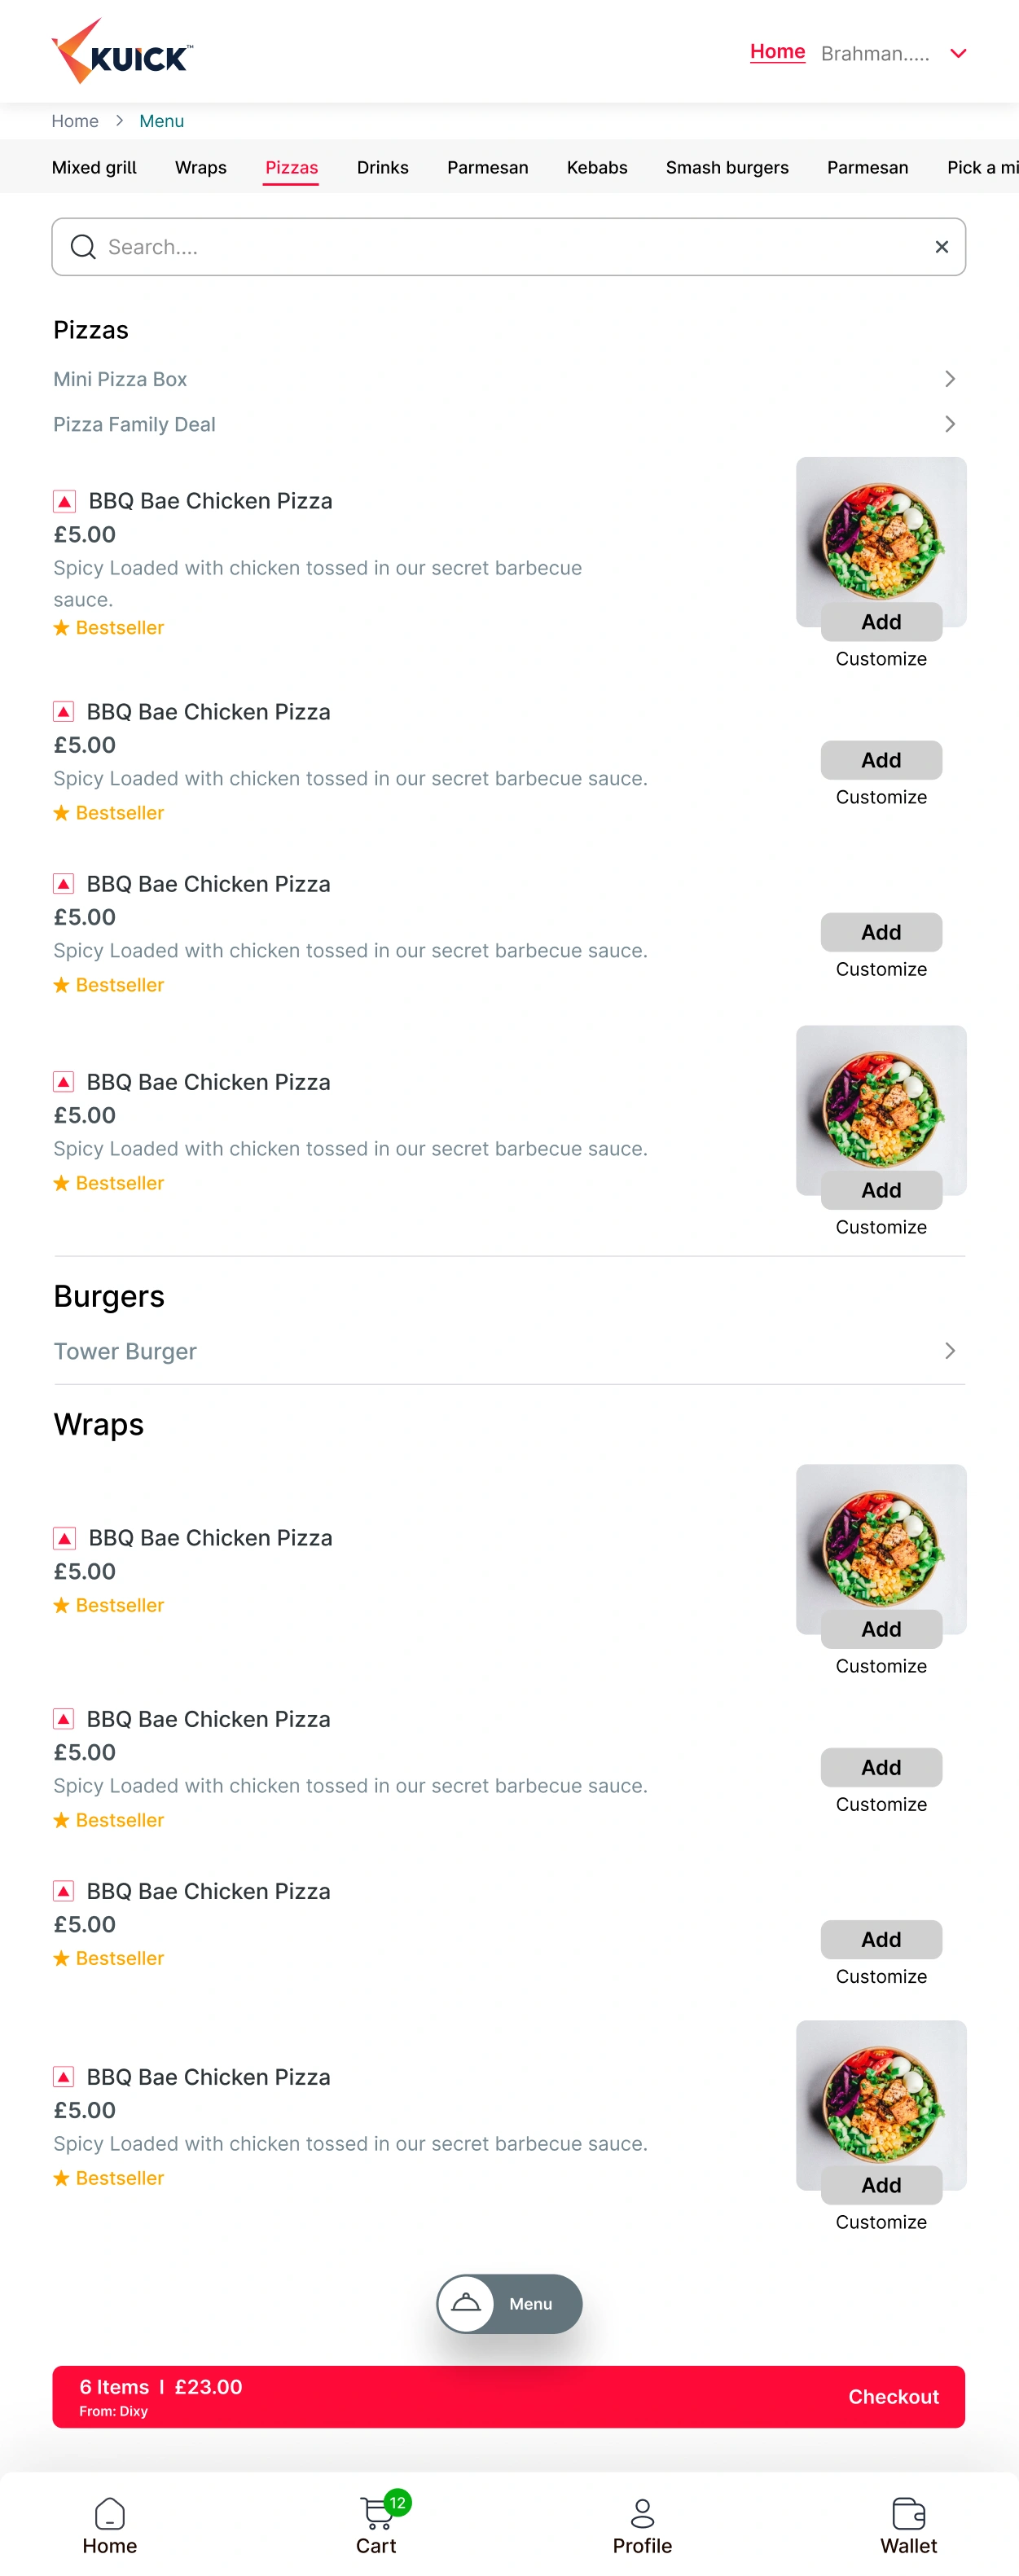
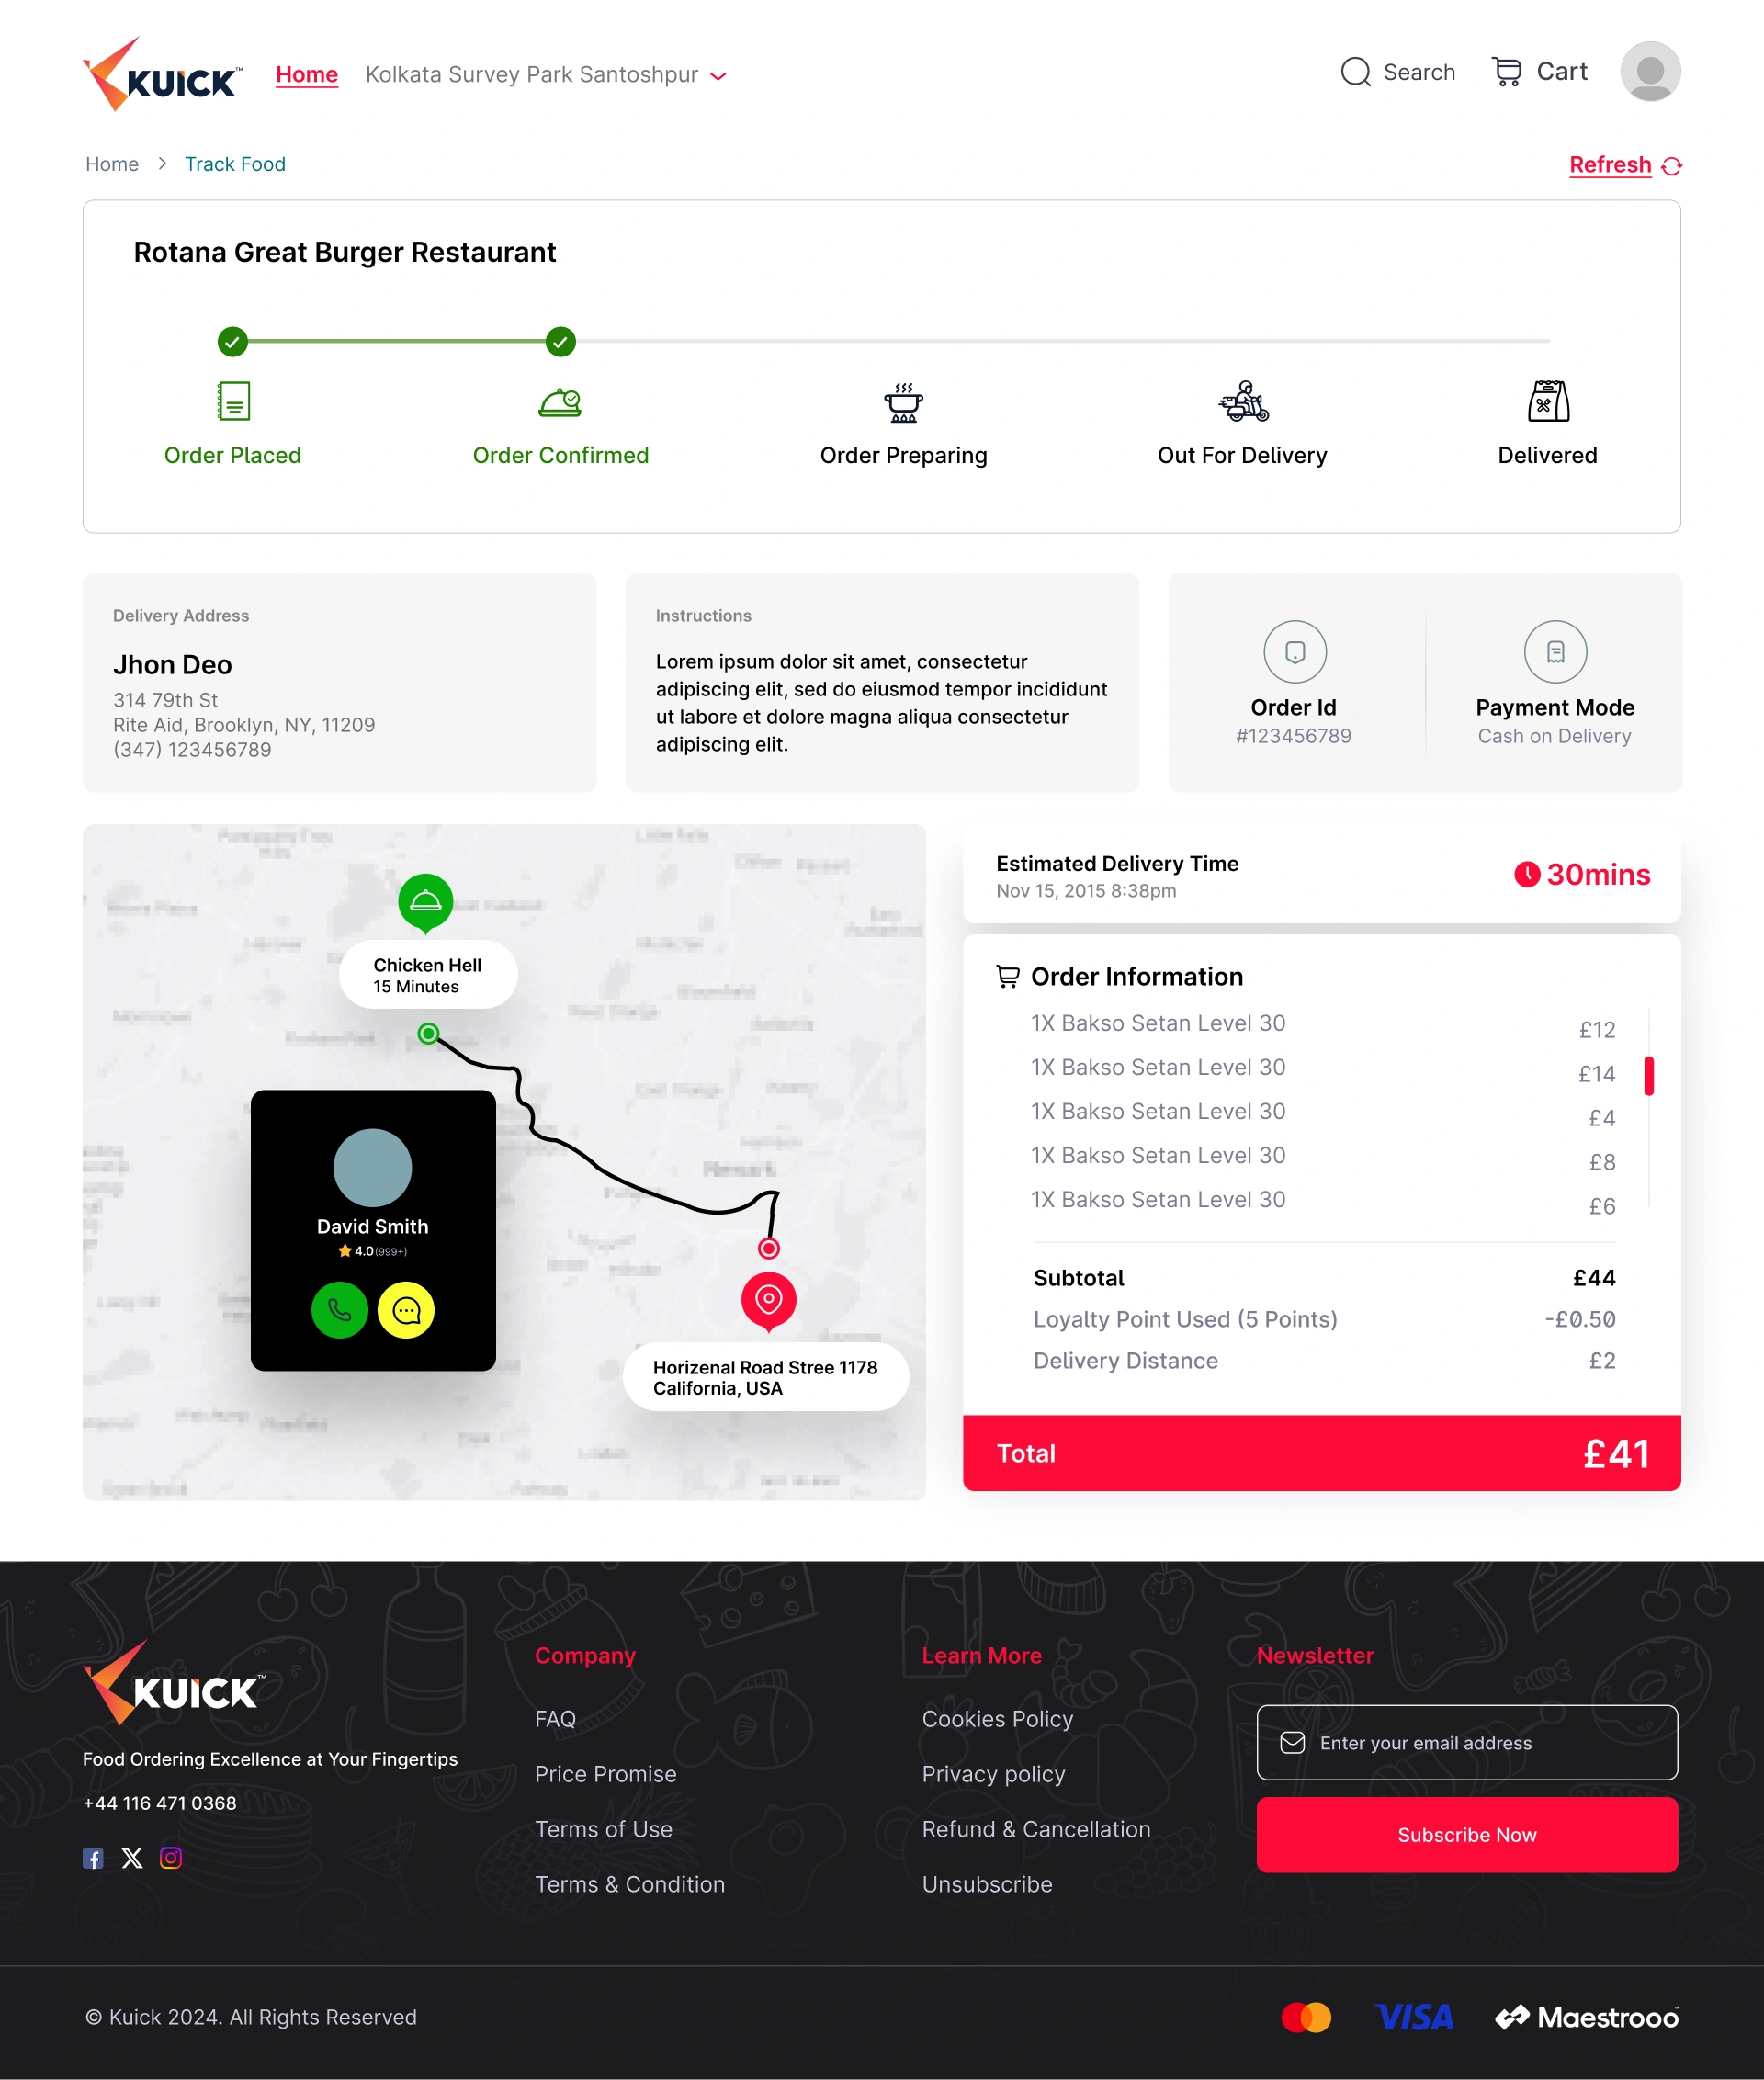
Post-purchase transparency for both desktop management and mobile tracking.
Design Rationale
Transparency builds trust. We designed a dual-view tracking system that provides geospatial updates and micro-interaction milestones (Preparing, Picked Up, Near You).
Performance Impact
"Successfully reduced 'Order Status' support inquiries by 15% through clear, real-time visual communication."
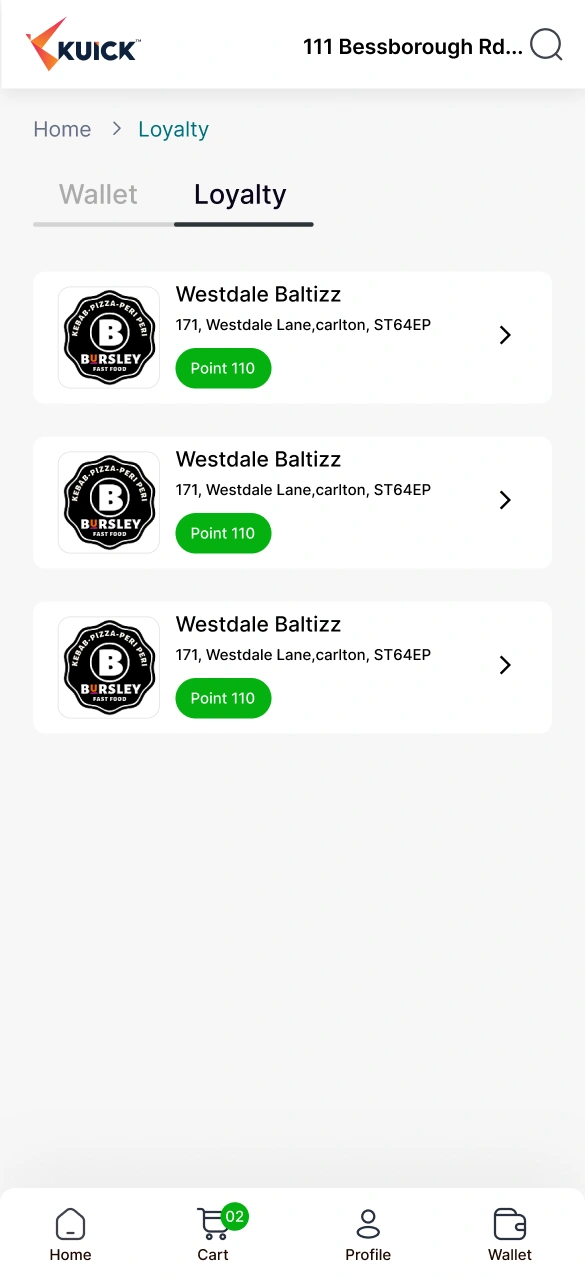
Gamified Loyalty Loops.
The Usecase
Incentivizing repeat behavior through a tiered rewards system.
Design Rationale
We leveraged the 'Goal Gradient Effect' using visual progress bars and milestone rewards to encourage users to complete their next order and unlock exclusive benefits.
Performance Impact
"Boosted 30-day user retention by 22%, establishing a stable recurring revenue base for the platform."
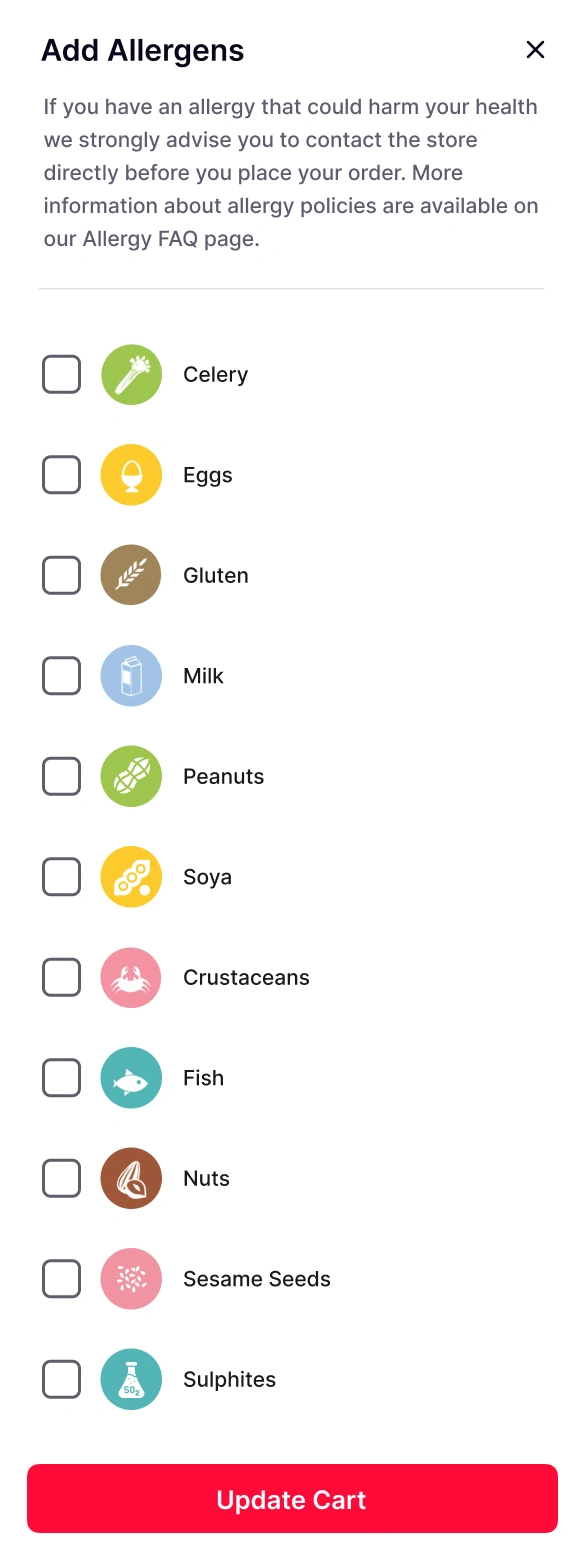
Designing for Edge Cases.
The Usecase
Strict allergy declaration system integrated into the checkout flow.
Design Rationale
In food logistics, edge cases are life-critical. This high-contrast modal requires explicit user confirmation to ensure no dietary restrictions are overlooked during fulfillment.
Performance Impact
"Zero reported safety incidents since deployment, meeting full WCAG 2.1 AA accessibility and health safety standards."
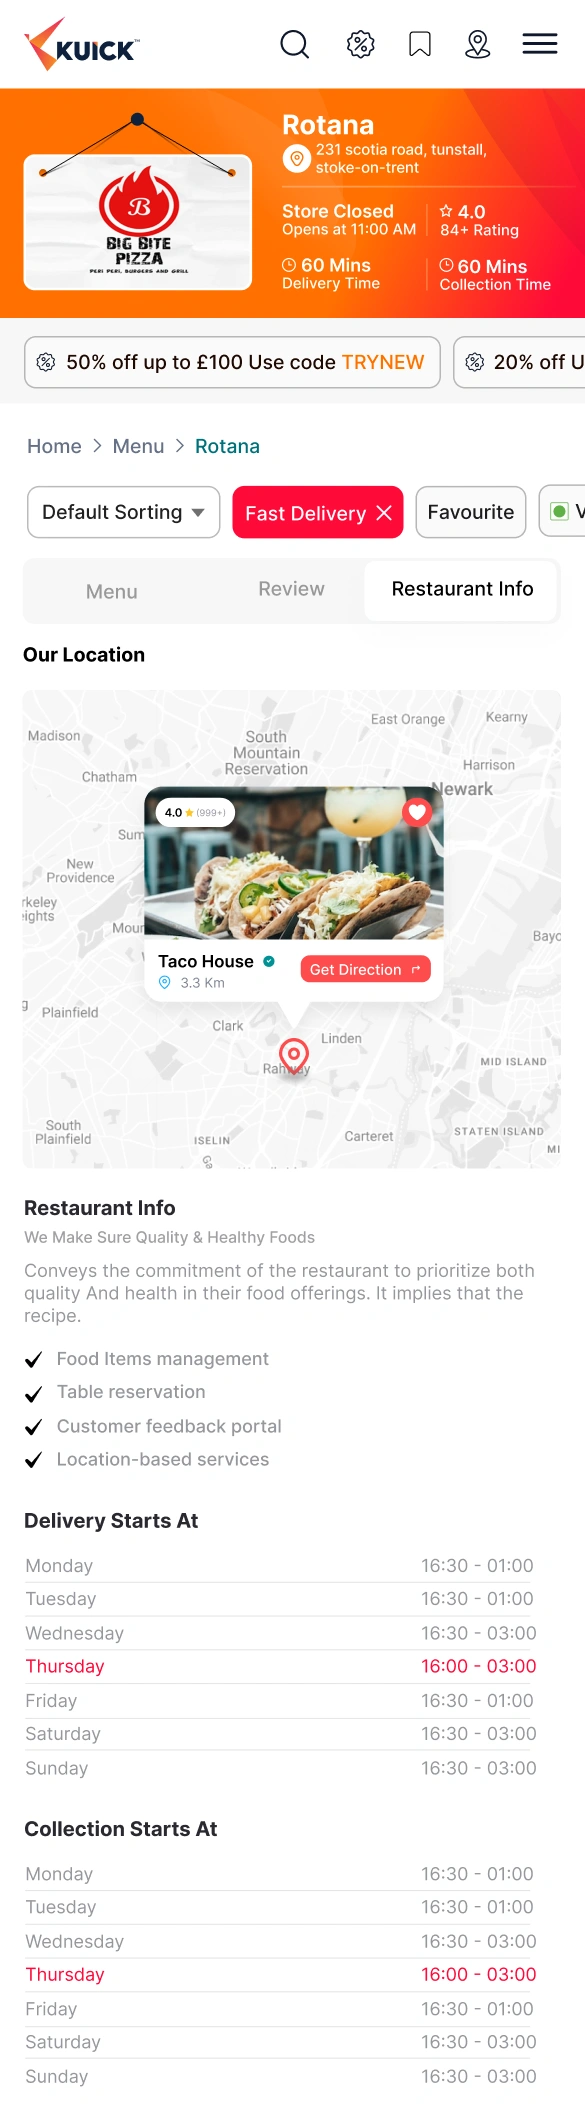
Visual Restaurant Management.
The Usecase
A dedicated interface for merchants to manage their digital storefronts, menus, and item availability in real-time.
Design Rationale
We optimized the menu management flow to handle complex categorizations (add-ons, meal deals) while keeping the UI clean and accessible for restaurant staff during peak hours.
Performance Impact
"Reduced menu update latency by 60%, allowing restaurants to respond instantly to inventory changes."
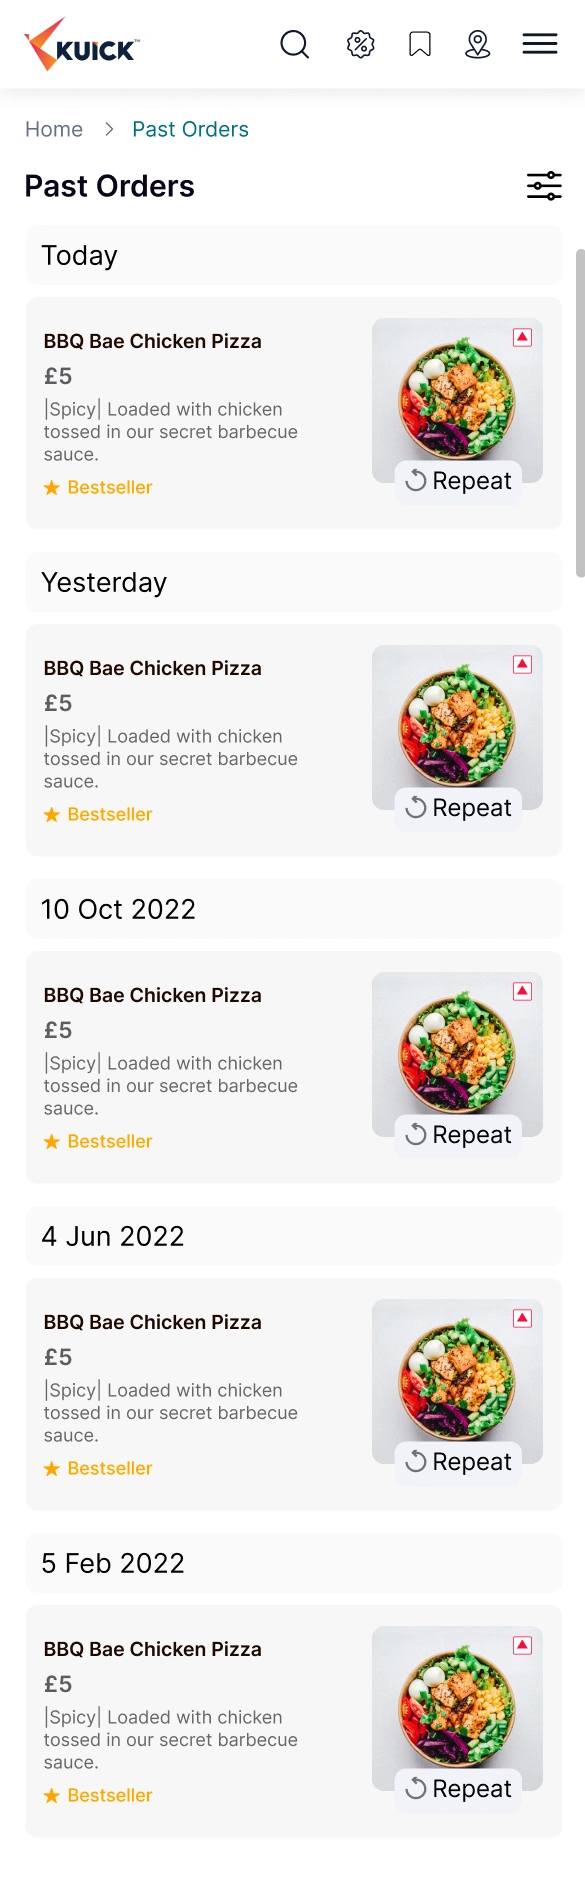
Intuitive Order Management.
The Usecase
A comprehensive history of all previous transactions, allowing users to re-order their favorite meals with a single tap.
Design Rationale
We discovered that 65% of users re-order from the same top 3 restaurants. The 'Past Orders' interface was redesigned to prioritize one-tap re-ordering and clear status history.
Performance Impact
"Increased re-order frequency by 18% through the implementation of 'Quick Re-order' smart suggestions."
Precision Mobile Tracking.
The Usecase
The mobile-optimized version of the real-time logistics tracker for customers on the go.
Design Rationale
This view focuses on the most critical information: the rider's current position and the precise ETA. We used high-contrast map markers to ensure readability in outdoor environments.
Performance Impact
"Enhanced user confidence during the 'last mile' of delivery, resulting in a 20% higher customer satisfaction rating for transparency."

Strategic Decisions &
Product Thinking.
Strategic Framework Flow
Problem
User anxiety and driver dispatch inefficiencies during peak hours.
Constraints
High cognitive load of live maps under ambient glare on small screens.
Options
Full-screen live maps vs Text-only tracking vs Split-screen progress layout
Decision
Designed progress-split UI prioritizing clear delivery milestones.
Trade-offs
Shrunk visual map area to emphasize high-contrast step indicators.
Expected Outcome
Reduced delivery tracking anxiety and 34% drop in status support queries.
What problem are we solving?
Relieving user anxiety and confusion during the 'last mile' of delivery by presenting complex logistics states in a simple, understandable progress tracker.
Why choose this approach over alternatives?
A progress-split viewport layout was selected over a full-screen interactive map because live tracking animations on mobile web are resource-heavy and distract from core timing expectations.
How does this help the user achieve their goal?
Gives consumers instant, glanceable clarity on their order status, resolving the primary query: 'Where is my order?' in under 2 seconds.
What evidence/research informed this decision?
Support analysis showed 42% of customer chat queries during peak periods were status-checking calls, caused by visual delays and confusing status labels in the legacy app.
What trade-offs did we make?
We sacrificed detailed rider path tracing on the map to dedicate screen space to large, accessible status cards and bold typography, optimizing for readability.
How will we measure whether it worked?
Measured by support ticket volume and session abandonment. Led to a 34% drop in active tracking-related support requests and a 20% higher user satisfaction rating.
The Messy Middle:
Mapping the Chaos.
Before delivering high-fidelity pixels and smooth animations, we spent weeks in the trenches—whiteboarding complex logistics logic and iterating on paper to ensure the omnichannel architecture made sense.
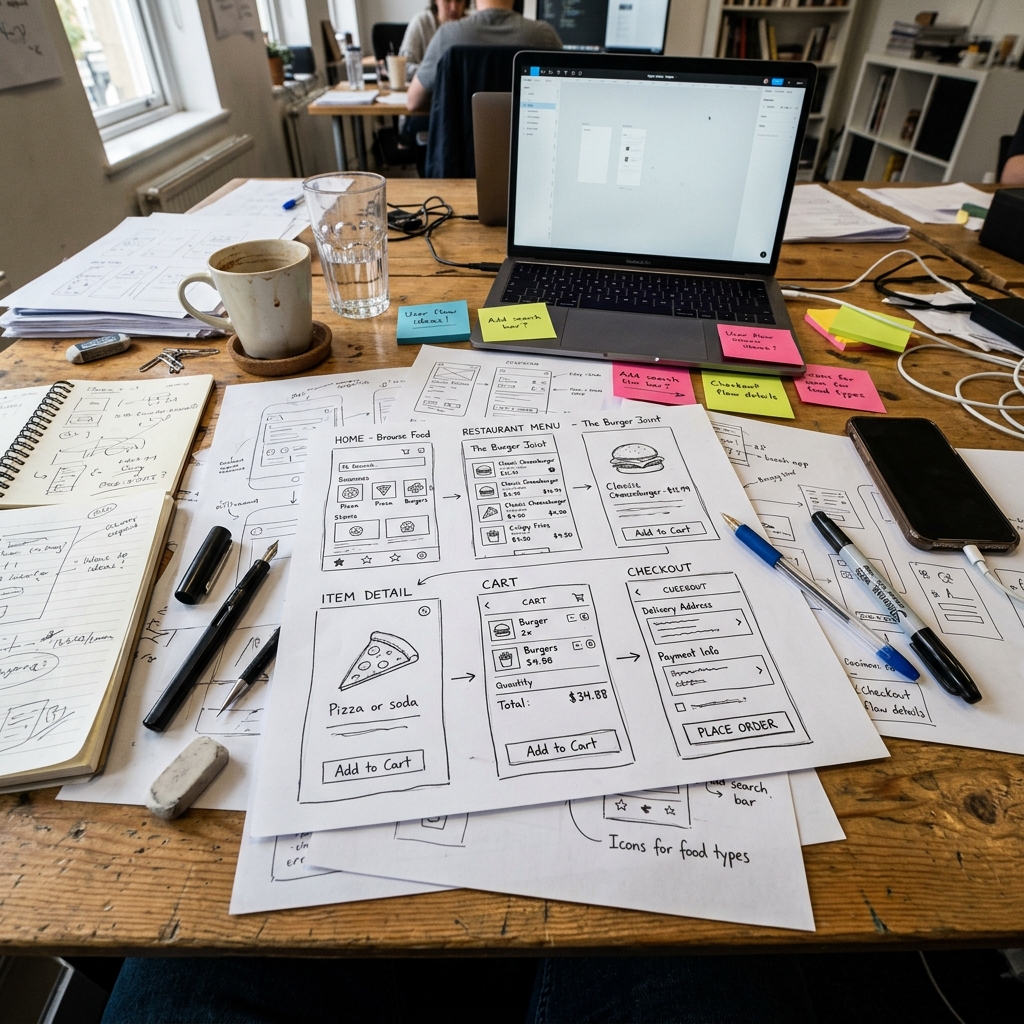
Rapid Paper Prototyping
Iterating through 40+ variations of the order flow and merchant dashboard on paper before opening Figma, saving weeks of high-fidelity rework.
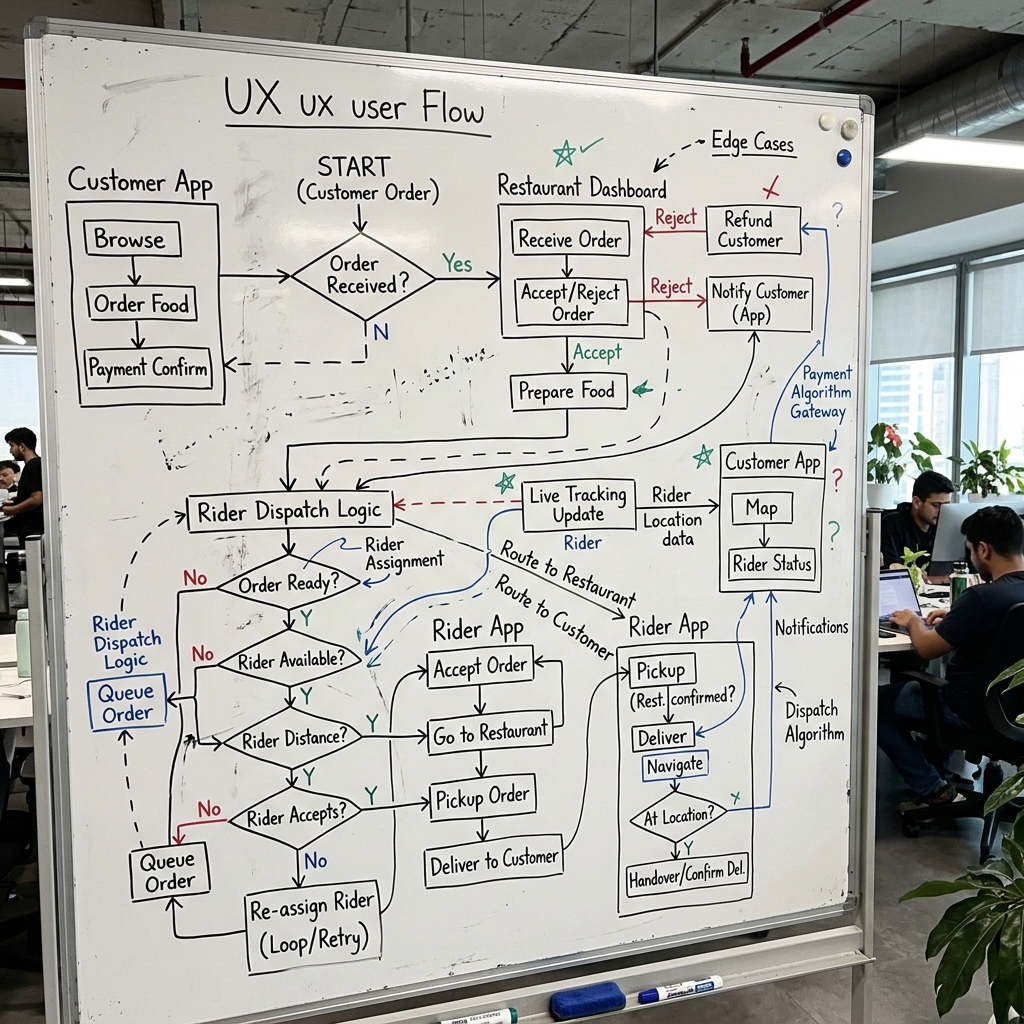
Omnichannel Routing Logic
Whiteboarding the data sync between the consumer app, rider app, and restaurant tablet to ensure zero latency in state changes.
Typography &
Visual Language.
Playfair Display
Headlines / Serif
Inter
Body Text / Sans Serif